Location Progress & Performance Tracking helps you measure how each store, warehouse, or pickup point is performing over time—using sales, inventory, customer activity, and profitability data in one unified system.
This feature combines real-time tracking, historical trends, and exportable reports to support data-driven decisions.
Where to Track Location Performance
You can monitor location progress from two main areas:
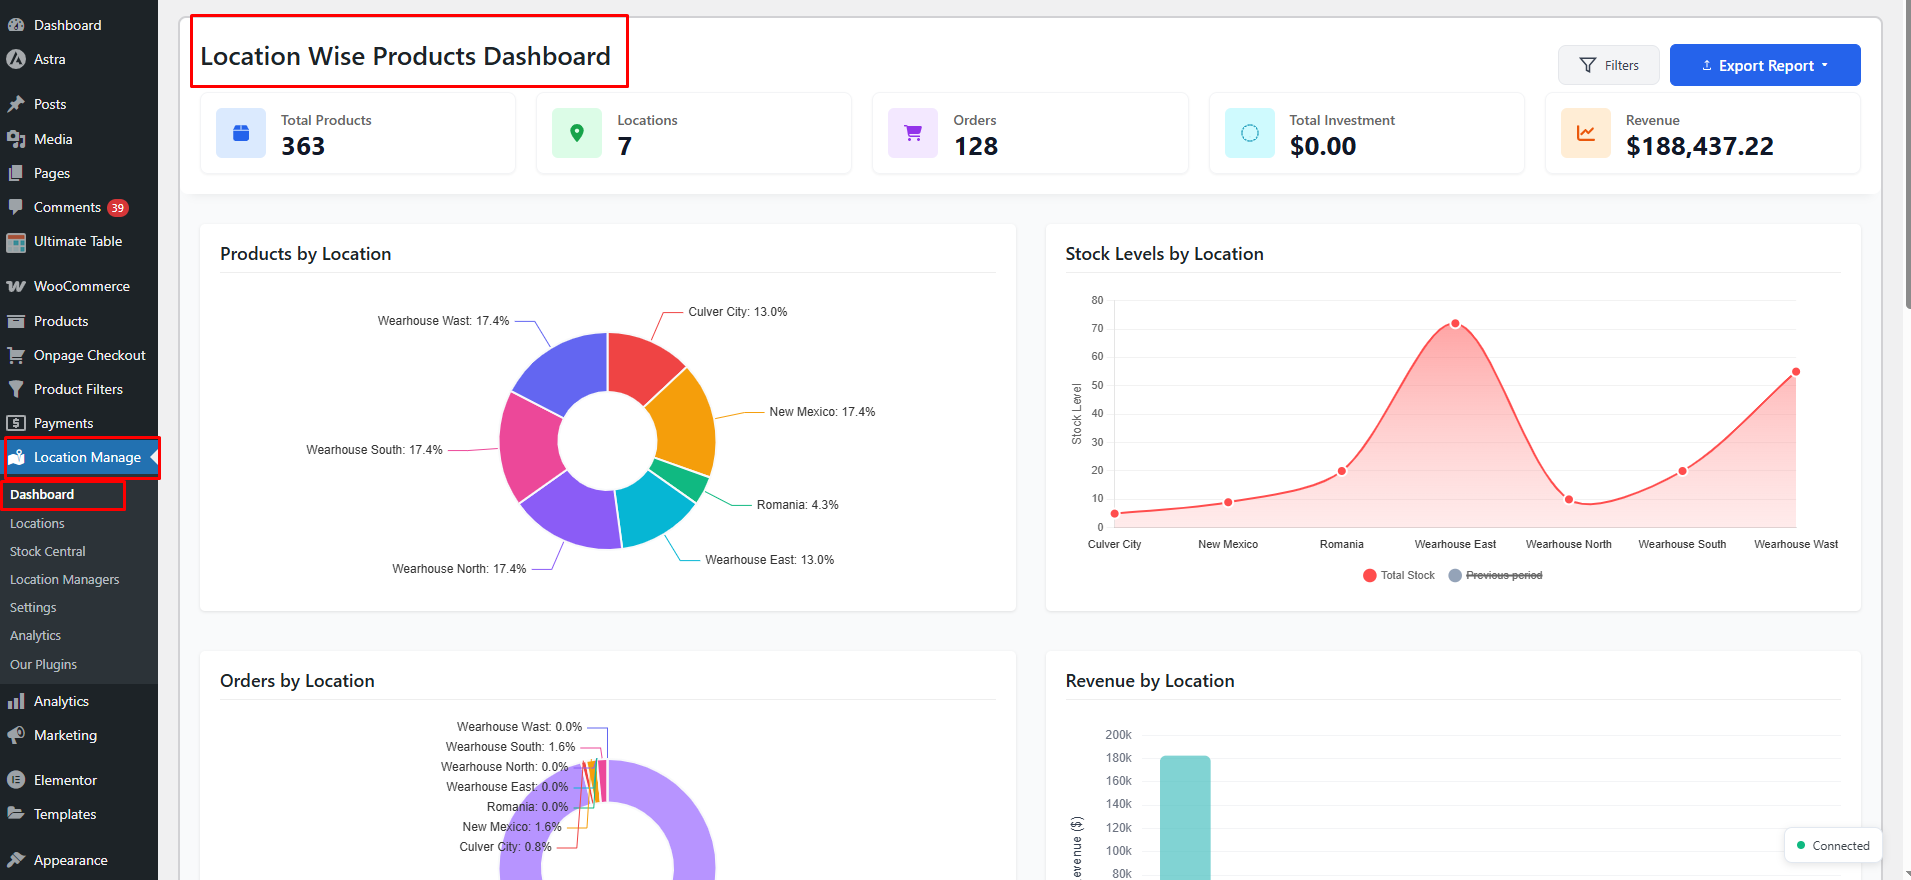
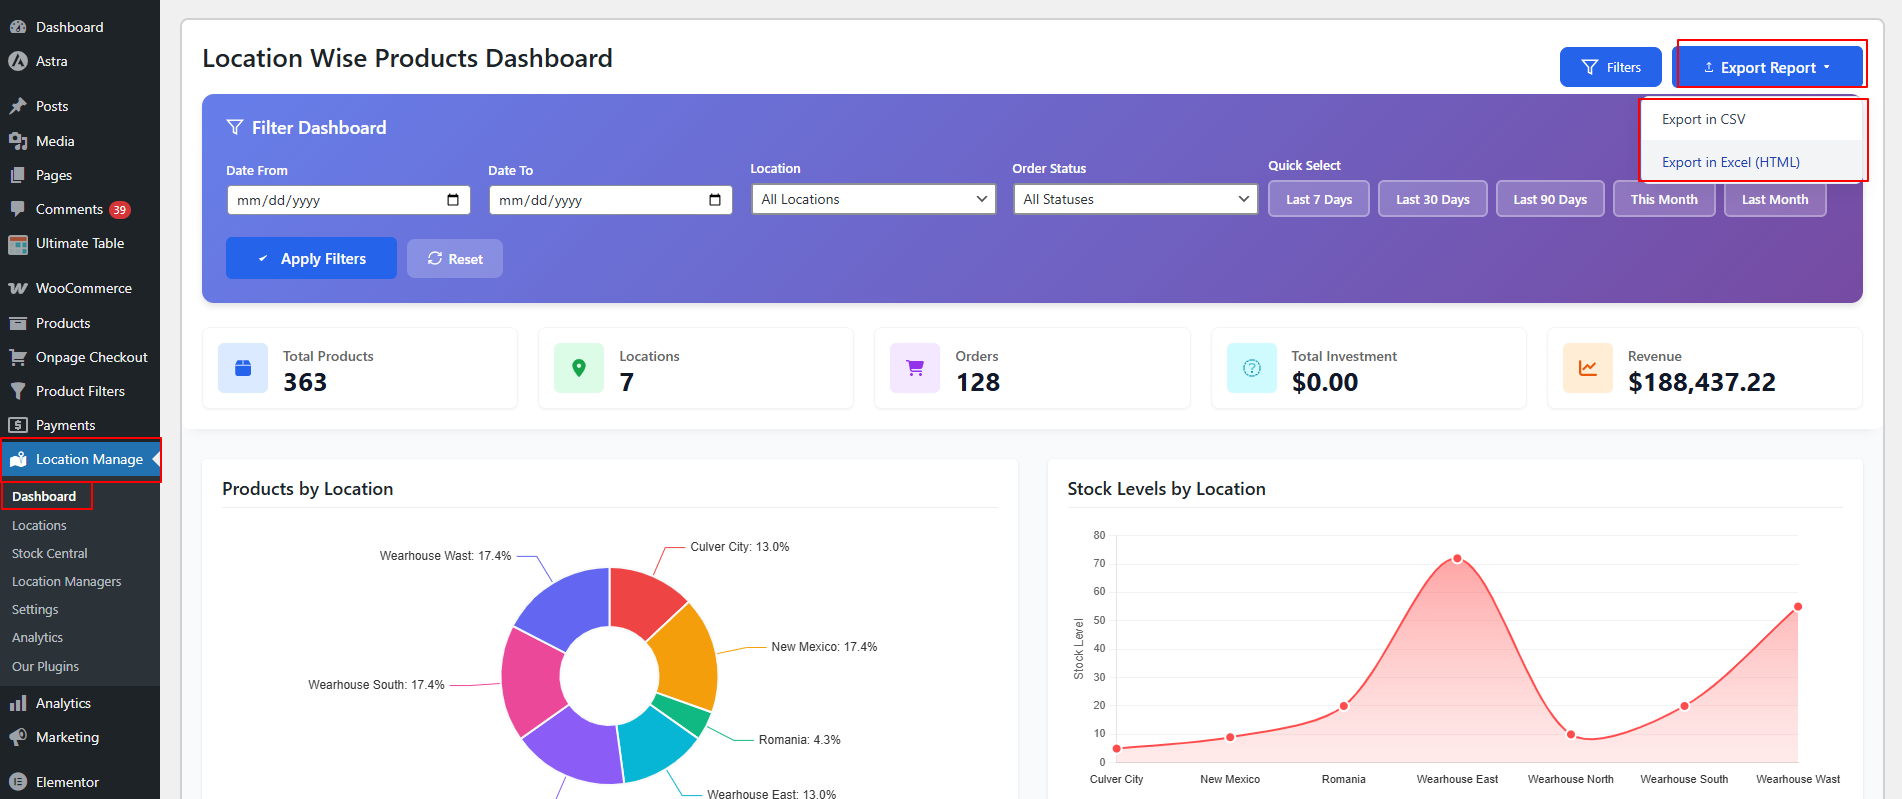
1️⃣ Dashboard Overview
WordPress Admin → Location Manage → Dashboard
You can check out the Dashboard Overview documentation for a detailed guide.
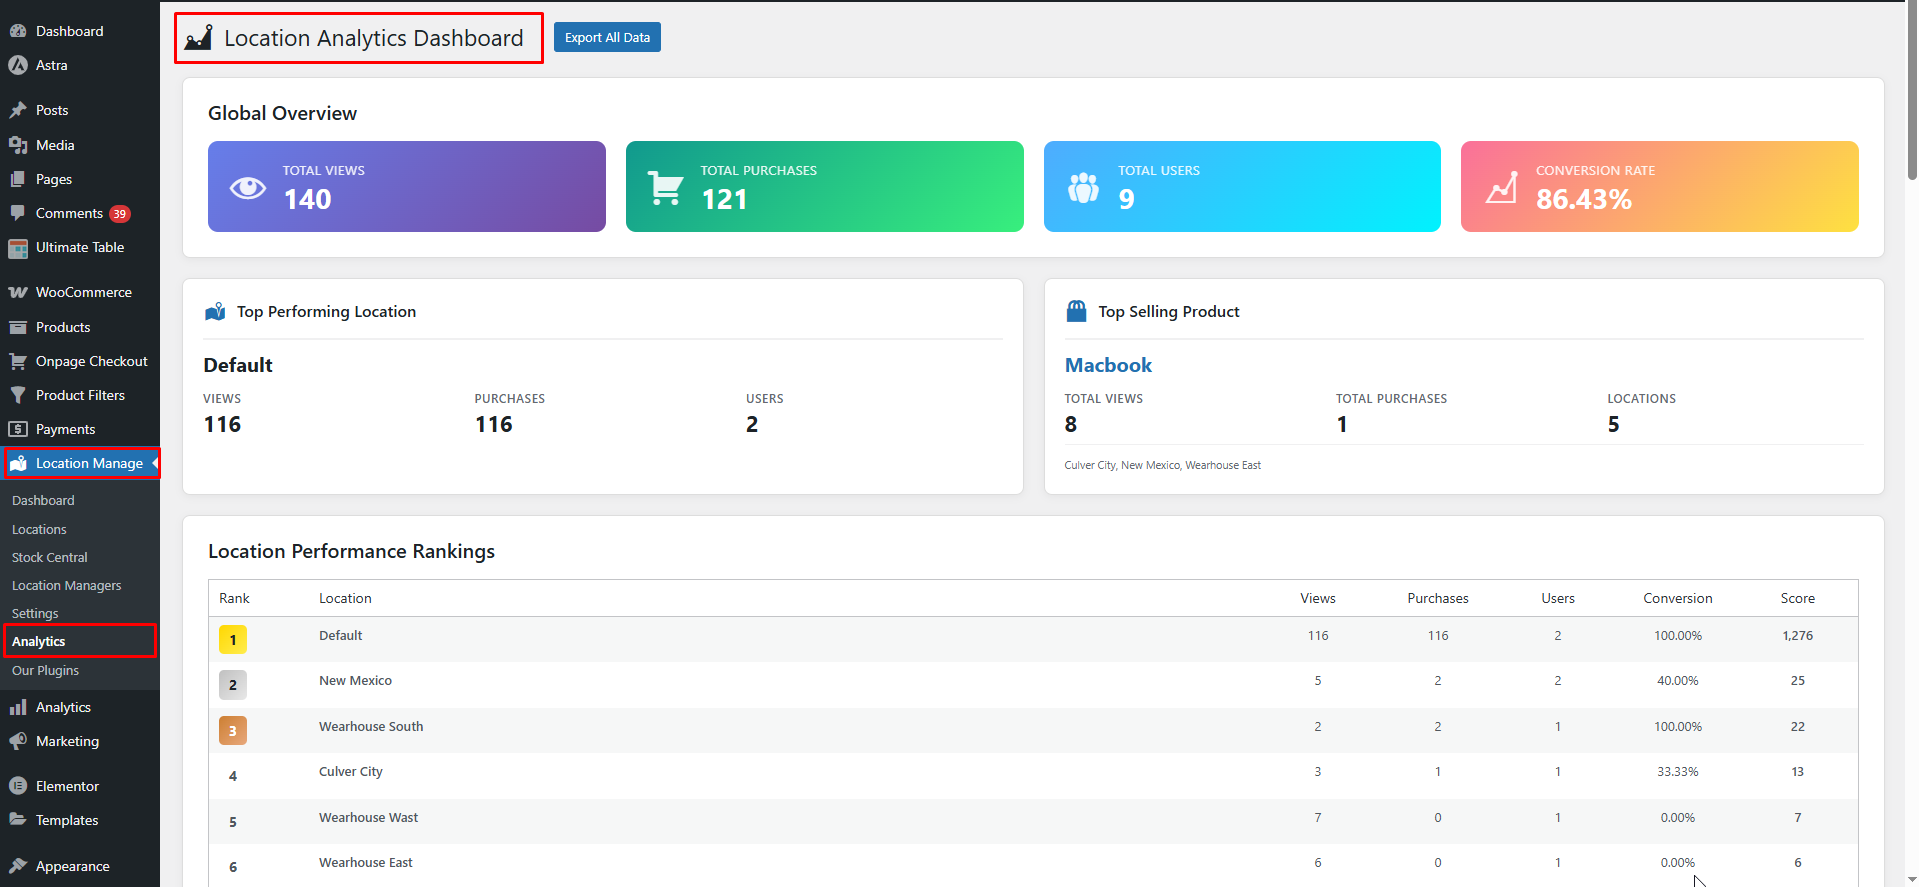
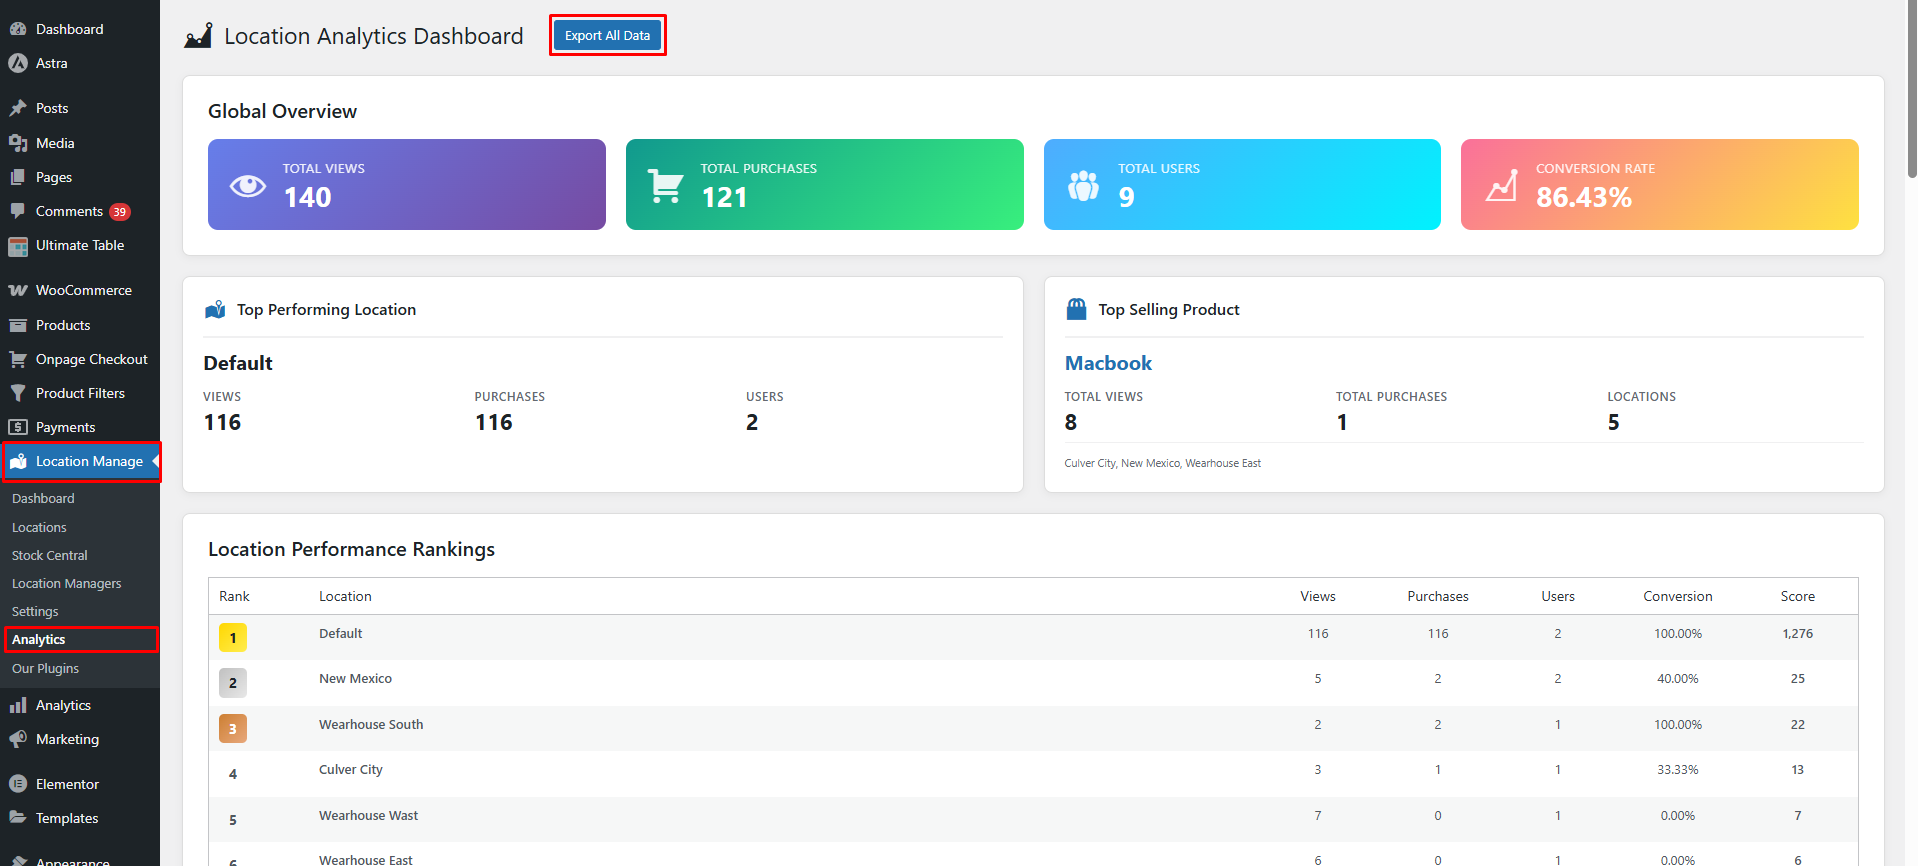
2️⃣ Analytics Dashboard
WooCommerce → Location Manage → Analytics
What “Progress & Performance” Tracks
📦 Inventory Progress
- Total stock per location
- Stock movement over time
- Low stock and out-of-stock trends
- Dead stock (not sold in last 90 days)
- Inventory aging (average days in stock)
Helps answer:
- Which locations hold excess stock?
- Where inventory is moving slowly?
💰 Sales & Revenue Performance
- Orders per location
- Revenue per location
- High-value orders
- Month-wise revenue trends
Helps identify:
- Top-performing locations
- Underperforming stores
📈 Profitability Tracking
- Investment value (purchase price × quantity)
- Margin value and margin %
- Profitability by location
- Shrinkage % (stock mismatch)
This shows:
- ROI per location
- Capital locked in inventory
- Risk areas due to shrinkage
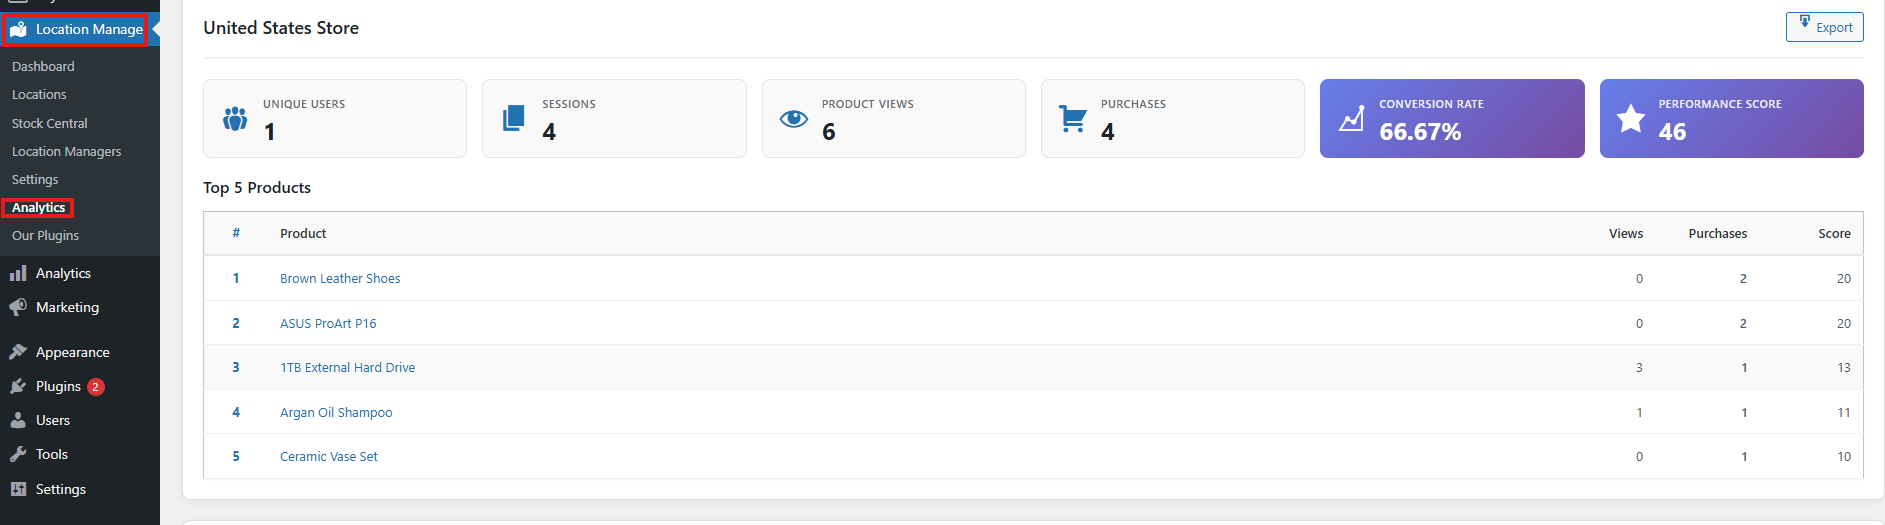
👥 Customer Activity (Analytics)
From Location Manage → Analytics:
- Unique users per location
- Total sessions
- Product views
- Total purchases
- Top 5 products by popularity (per location)
Helps understand:
- Customer demand by region
- Location-based buying behavior
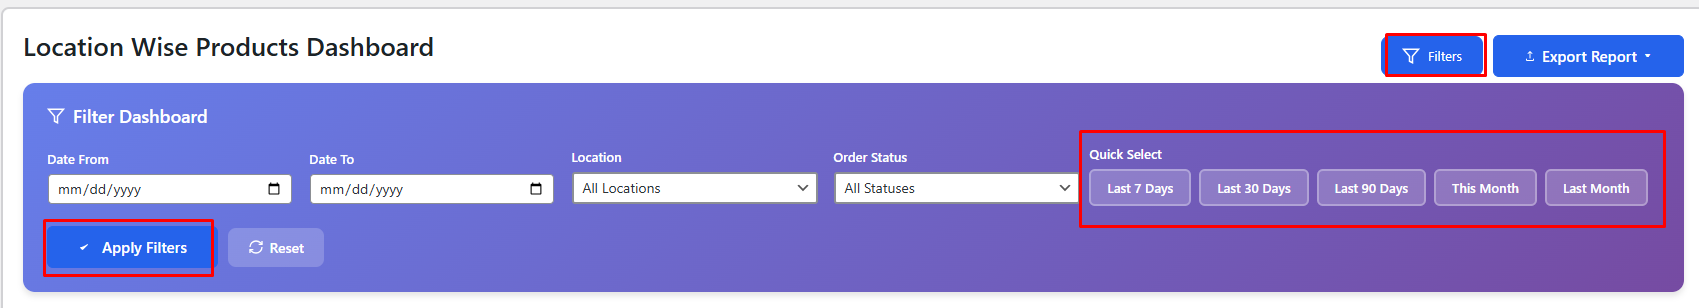
Time-Based Performance Analysis
Use filters and quick ranges to track progress over time:
- Last 7 Days
- Last 30 Days
- Last 90 Days
- This Month
- Last Month
- Custom date range
This allows you to:
- Compare month-over-month growth
- Track recovery or decline trends
- Measure campaign or promotion impact per location
Real-Time Performance Updates
Location performance updates automatically when Real-time alerts are enabled.
Enable Real-Time Updates
Go to:
Location Manage → Settings → Notifications
Enable:
- Real-time alerts → On
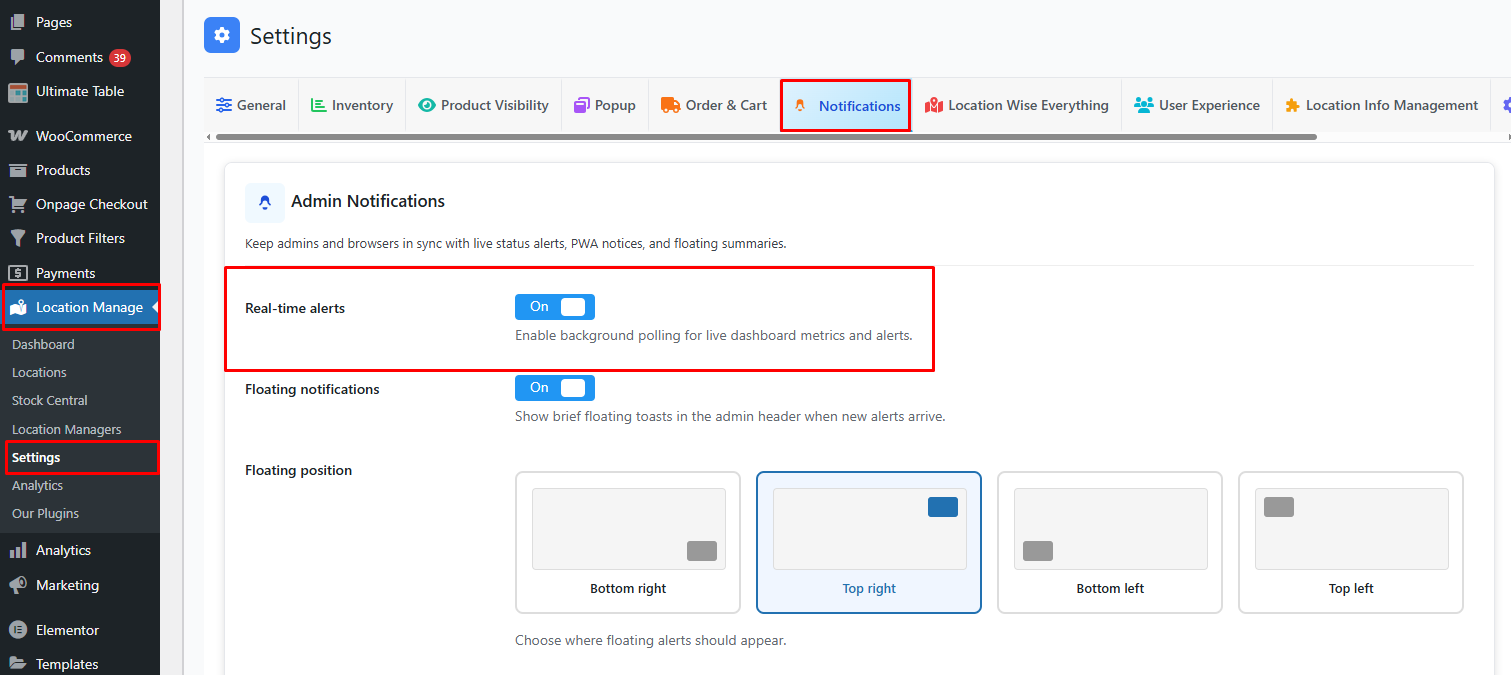
This allows:
- Live dashboard metric refresh
- Instant visibility into orders, revenue, and stock changes
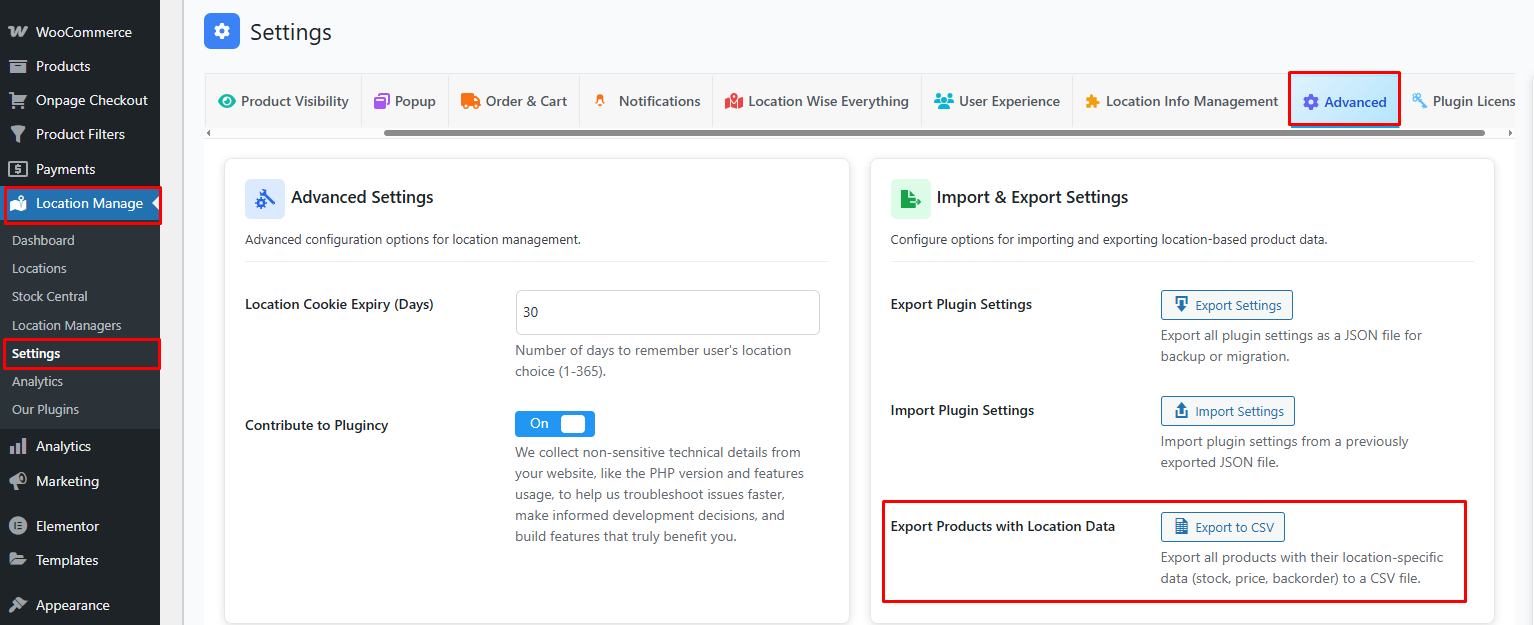
Export & Review Performance
You can export performance data for deeper analysis:
- Dashboard → Export Report
- CSV (raw data)
- Excel (HTML) – visual report
- Analytics → Export All Data
- Settings → Advanced → Export Products with Location Data
Useful for:
- Management reviews
- Accounting & forecasting
- External BI tools
Key Performance Indicators (KPIs) by Location
| KPI | Insight |
|---|---|
| Orders | Sales volume |
| Revenue | Financial performance |
| Inventory Value | Capital invested |
| Margin % | Profitability |
| Dead Stock | Slow-moving risk |
| Avg Age | Inventory health |
| Customer Sessions | Demand level |
Best Use Cases
- Multi-store retail chains
- Warehouse performance monitoring
- Pickup-location optimization
- Regional sales analysis
- Inventory planning & forecasting
Summary
Location Progress & Performance Tracking gives you a clear, measurable view of how each location is growing, selling, and performing—in real time and over time—so you can optimize inventory, improve profitability, and scale with confidence.