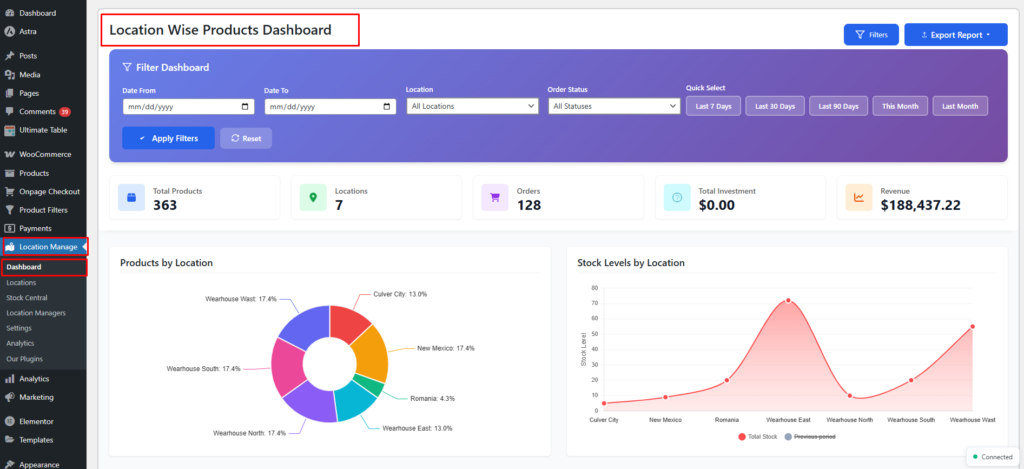
The Dashboard Overview provides a real-time, location-wise snapshot of your store’s products, stock, orders, revenue, investment, and profitability—all in one place.
Where to Find
Go to:
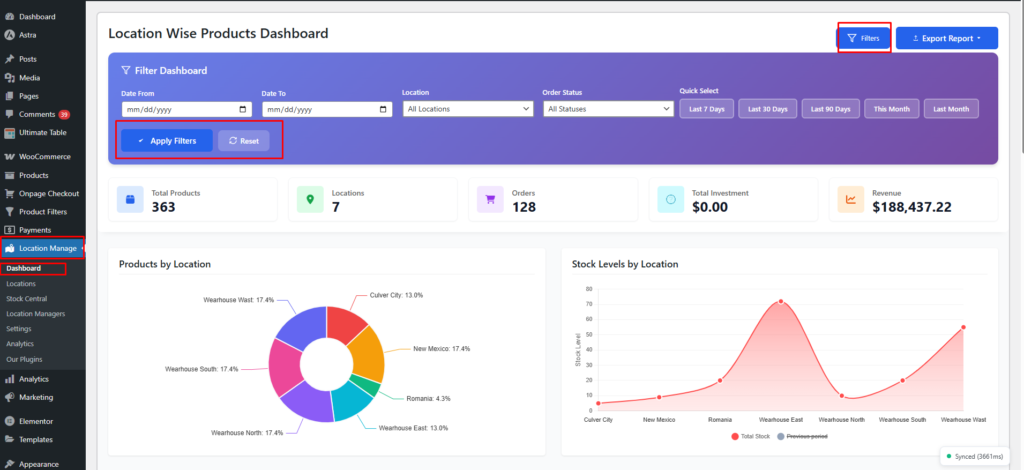
WordPress Admin → Location Manage → Dashboard→Location-Wise Products Dashboard
This dashboard aggregates key metrics across all locations and lets you drill down using filters, exports, and visual reports.
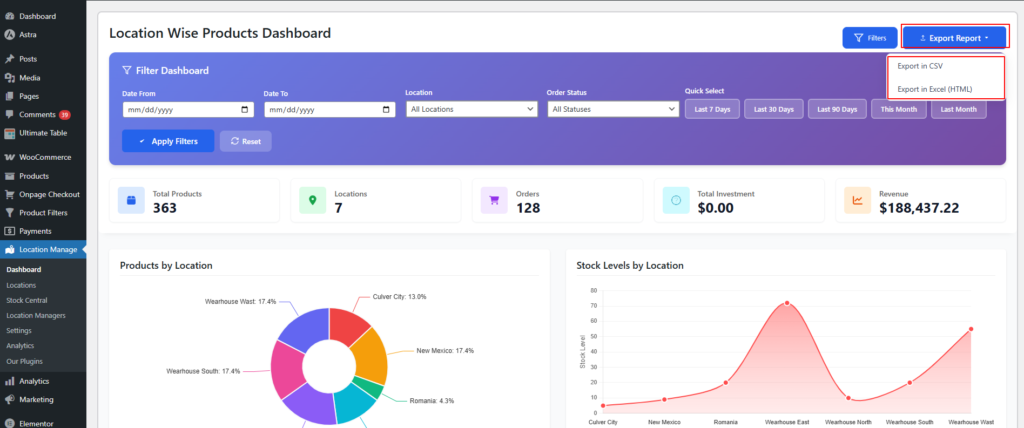
Export Reports
Click Export Report to download dashboard data:
- Export in CSV
- Export in Excel (HTML)
Ideal for accounting, reporting, or sharing with your team.
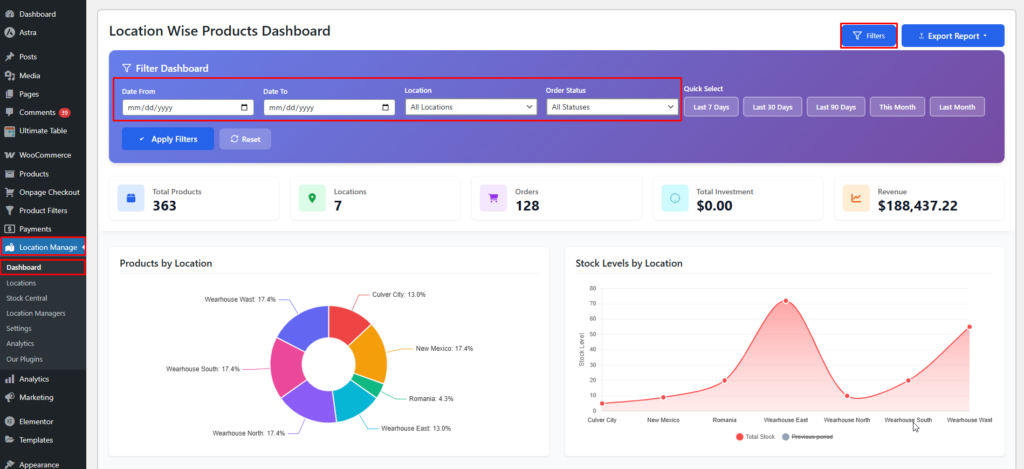
Filters
Use filters to refine dashboard data precisely.
Available Filters
- Date From / Date To
(mm/dd/yyyy) - Location
- All Locations
- Order Status
- All Statuses
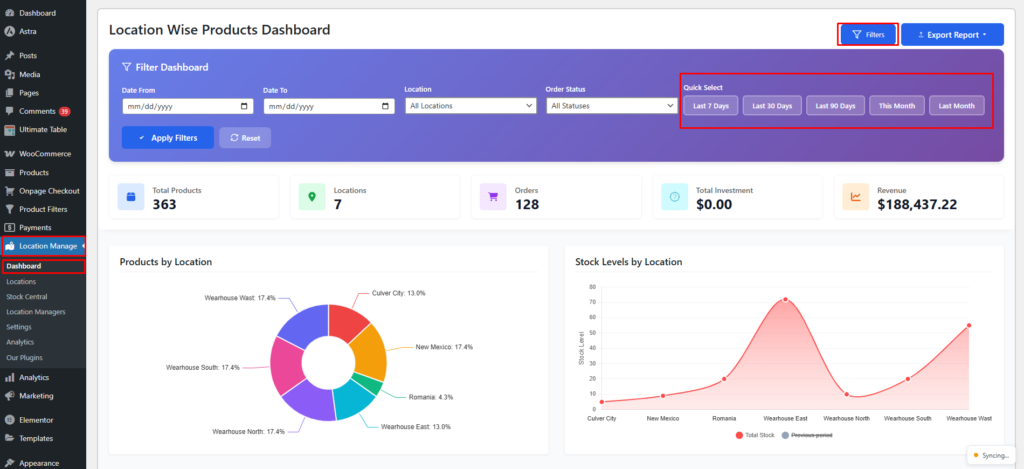
Quick Select
- Last 7 Days
- Last 30 Days
- Last 90 Days
- This Month
- Last Month
Buttons:
- Apply Filters
- Reset
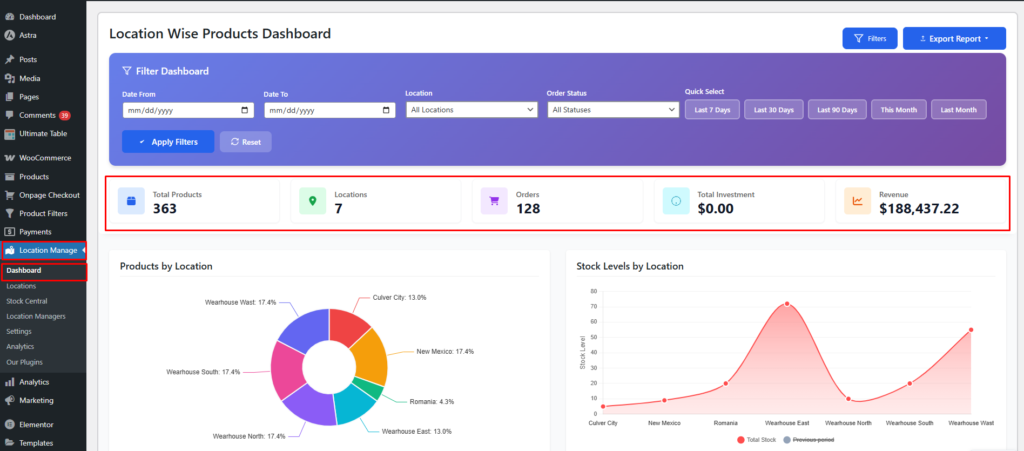
Key Summary Metrics
At the top of the dashboard you’ll see:
- Total Products:
- Locations:
- Orders:
- Total Investment:
- Revenue:
These values update dynamically based on applied filters.
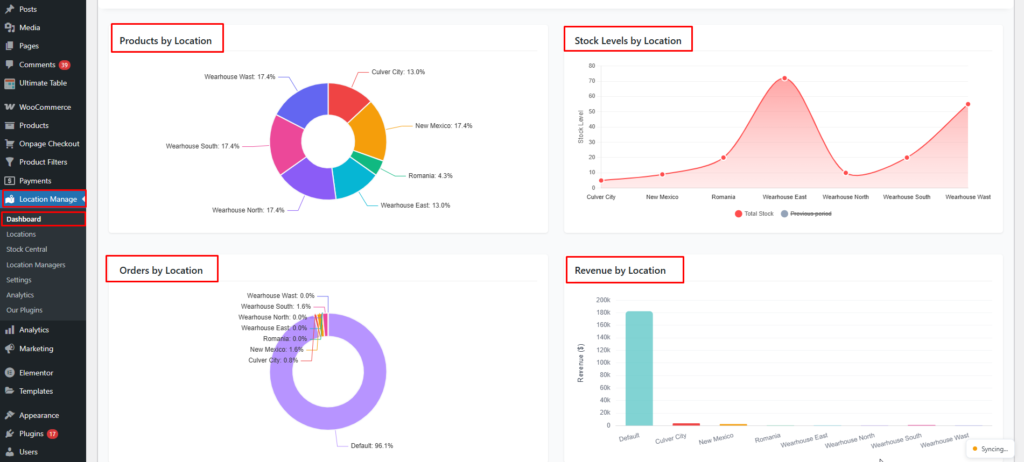
Visual Reports & Widgets
The dashboard includes multiple charts and tables for quick insights:
- Products by Location
- Stock Levels by Location
- Orders by Location
- Revenue by Location
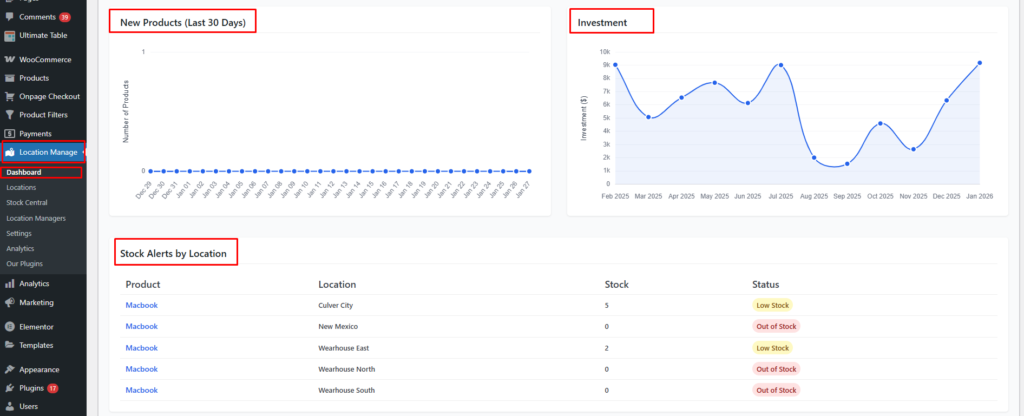
- New Products (Last 30 Days)
- Investment
- Low Stock Products by Location
If no low stock items exist, you’ll see:
No low stock products found for any location.
Profitability & Aging by Location
This table provides deep financial insights per location.
Important Definitions
- Dead Stock: Inventory that has not sold in the last 90 days
- Shrinkage: Sold quantity that could not be matched to current stock records
Columns Explained
| Column | Description |
|---|---|
| Location | Store / warehouse name |
| Inventory Value | Current stock investment value |
| Margin Value | Total profit amount |
| Margin % | Profit margin percentage |
| Dead Stock Value | Value of unsold stock (90+ days) |
| Dead Stock Units | Units not sold in last 90 days |
| Avg. Age (days) | Average inventory age |
| Shrinkage % | Inventory mismatch percentage |
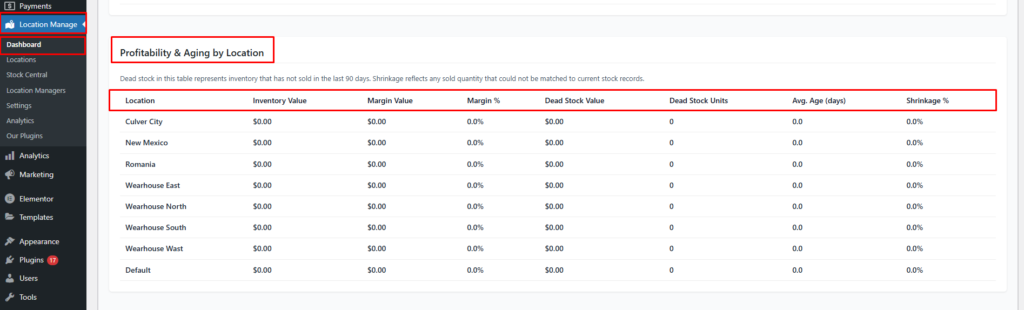
Each location is evaluated independently for performance and risk.
Real-Time Dashboard Updates
The dashboard supports live updates using the notification system.
Enable Real-Time Updates
Go to:
WordPress Admin → Settings → Notifications
Enable:
Real-time alerts → On
Enables background polling for live dashboard metrics and alerts.
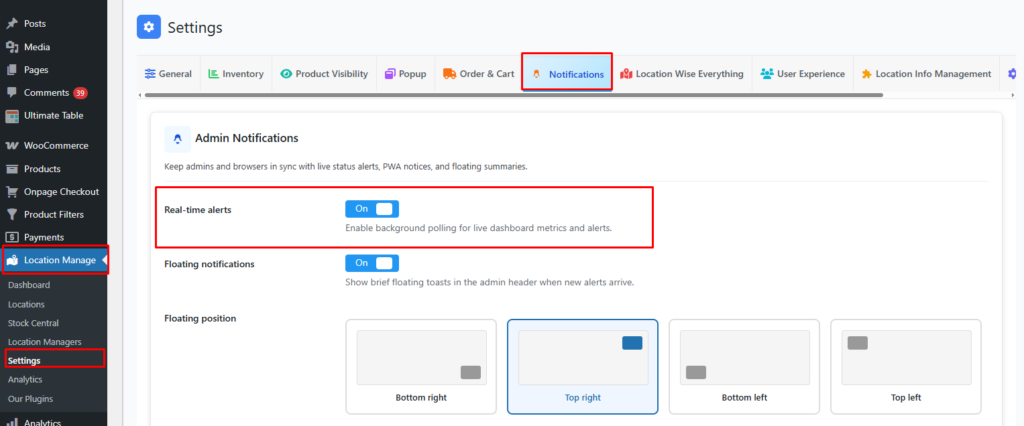
Once enabled:
- Dashboard stats refresh automatically
- New orders, revenue, and stock changes appear without page reload
Best Use Cases
- Monitor multi-store performance
- Track investment vs revenue
- Identify dead or slow-moving stock
- Compare profitability by location
- Export data for finance & management
Summary
The Location-Wise Dashboard is your command center—combining inventory, sales, finance, and performance analytics with real-time updates, powerful filters, and export tools to help you make data-driven decisions faster.