The Investment Calculator helps you track purchase cost, revenue, profit, and inventory aging across all locations—using data you already manage in Product Edit and Stock Central.
This system turns stock data into clear financial insights, without external tools.
Where to Configure Purchase Data
Purchase information can be set from two places:
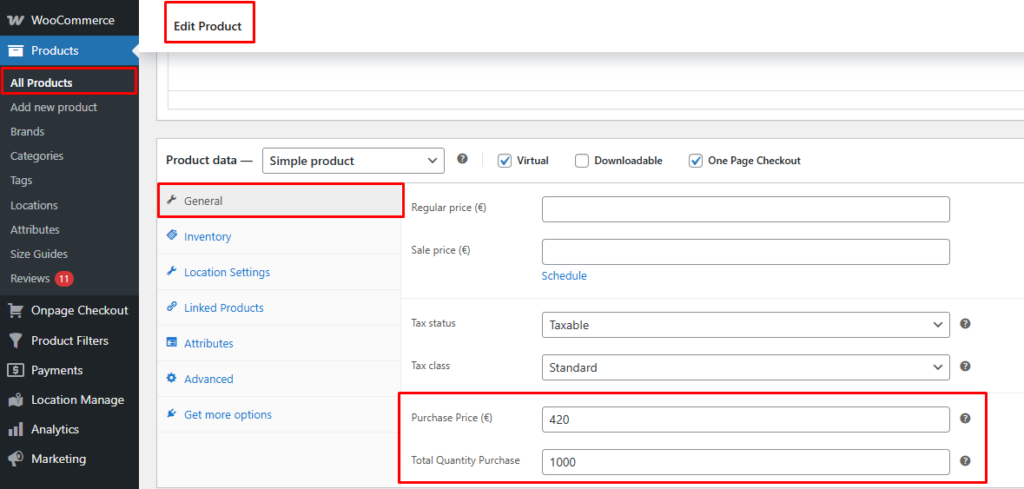
1️⃣ Product Edit Page
For each product (and variation, if applicable), you can define:
- Purchase Price
- Purchase Quantity
This is useful when configuring products individually.
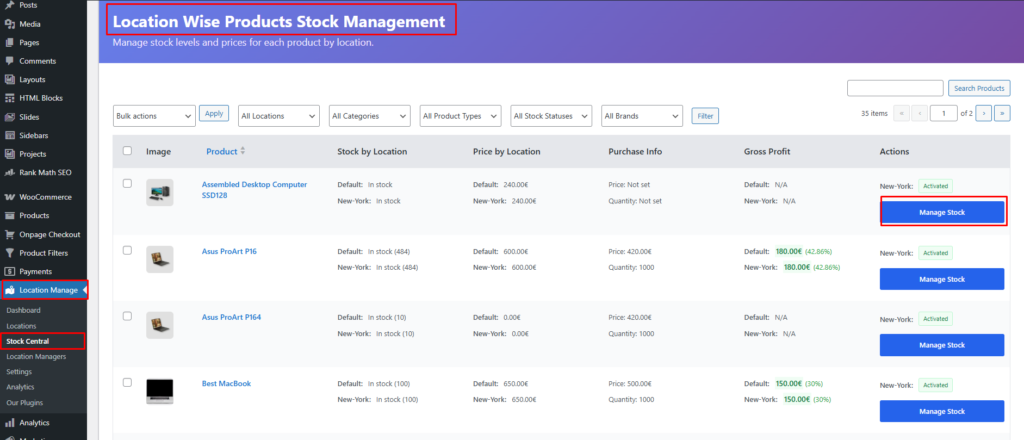
2️⃣ Stock Central (Recommended)
Stock Central is the fastest way to manage purchase data in bulk.
WordPress Admin → Location Manage → Stock Central
From the shared popup modal (Quick Edit / Manage Location / Add Location), you can set:
- Purchase Price
- Purchase Quantity
- Location-wise stock values
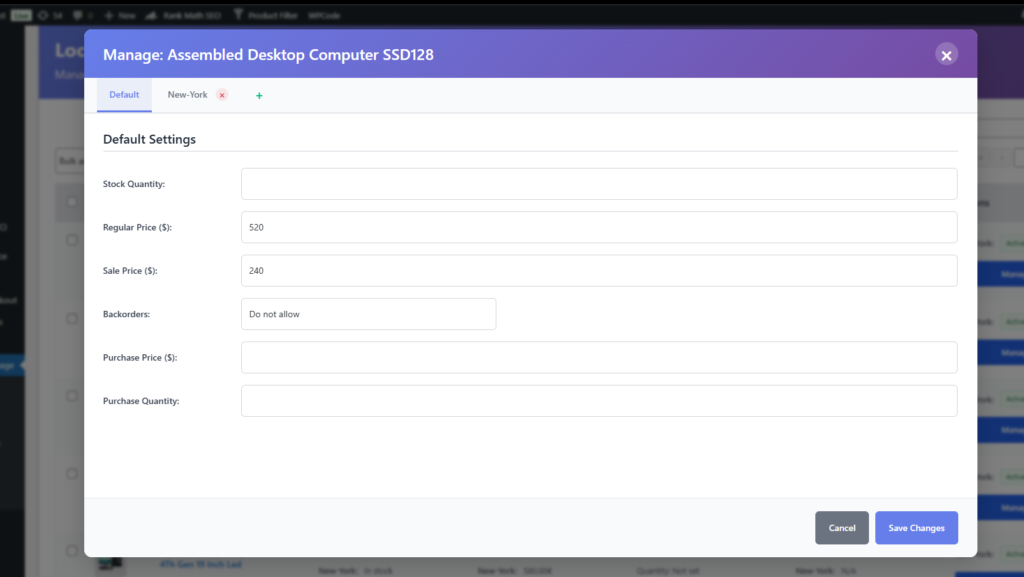
Changes are saved instantly via AJAX.
Stock Central – Purchase & Profit Columns
Stock Central includes financial insight columns for quick review:
Purchase Info Column
Displays:
- Purchase Price
- Purchase Quantity
This allows you to instantly see how much you invested in each product.

Gross Profit Column (Location-wise)
Displays:
- Revenue generated per location
- Profit calculation based on:
- Sale price
- Purchase price
- Quantity sold
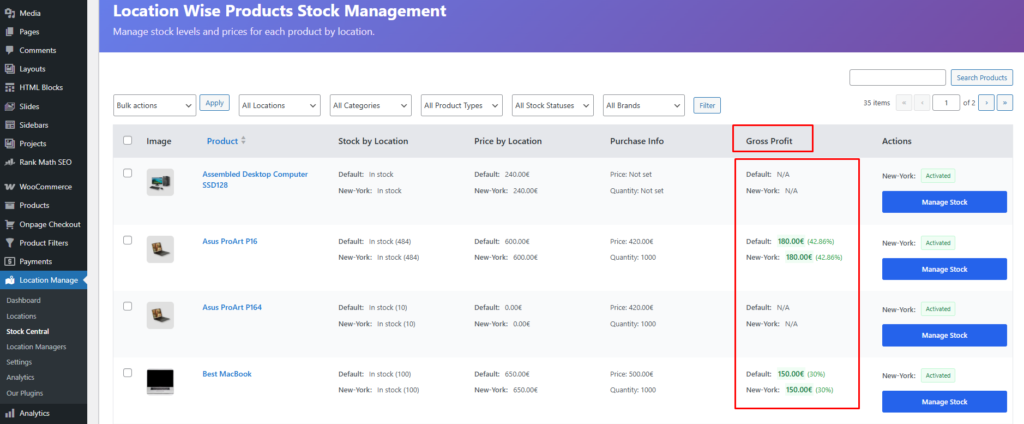
This helps you understand:
- Which locations are profitable
- Which products perform best per location
Dashboard Analytics (Automatic)
Once purchase data is configured, the dashboard automatically generates reports.
Total Investment
- Shows total capital invested across all products and locations
- Calculated using:
Purchase Price × Purchase Quantity
Month-wise Investment Chart
- Visual chart showing investments over time
- Helps track:
- Monthly buying trends
- Inventory growth patterns
Revenue by Location Chart
- Compares revenue across locations
- Quickly identify:
- Top-performing locations
- Underperforming stores
Profitability & Aging by Location
Shows:
- Profit generated per location
- Inventory aging (how long stock remains unsold)
- Helps detect:
- Slow-moving stock
- Capital locked in inventory
How Calculations Work (Logic Overview)
- Investment
= Purchase Price × Purchase Quantity - Revenue
= Sale Price × Quantity Sold (location-wise) - Gross Profit
= Revenue − Investment (or proportional purchase cost) - Aging
= Time stock remains in inventory per location
All calculations respect location-based overrides and variation-level data.
Supported Product Types
- Simple Products – Fully supported
- Variable Products – Variation-wise purchase & profit tracking
- Grouped Products – Not applicable (no direct stock)
- External/Affiliate Products – Supported for tracking (sales handled externally)
Key Benefits
- No manual spreadsheets
- Real-time financial visibility
- Location-wise profitability insights
- Smarter purchasing decisions
- Better inventory turnover tracking
Best Use Cases
- Multi-location retail stores
- Warehouse-based inventory systems
- Wholesale & distribution businesses
- Store managers tracking ROI per location
The Investment Calculator transforms your inventory data into actionable business intelligence, helping you invest smarter and grow profitably—all from inside WooCommerce.