The dashboard includes a visual reporting export that generates an Excel-compatible HTML report (saved with .xls). This export is designed to look clean and readable when opened in Microsoft Excel, while keeping the same sections you see in the dashboard.
Where to Export
Go to:
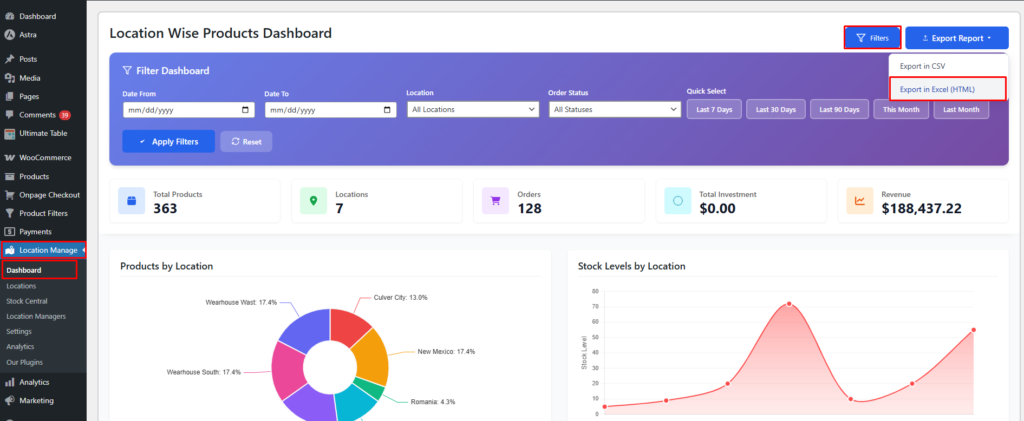
WordPress Admin → Location Manage → Dashboard
Then click:
Export Report → Export in Excel (HTML)
What “Excel (HTML)” Export Means
This export generates an HTML document styled with CSS, and downloads it as an .xls file so Excel can open it like a spreadsheet—while preserving:
- Section headers
- Table formatting
- Colors and badges
- Alternating row backgrounds
- Highlighted values (percentages, low/out stock indicators)
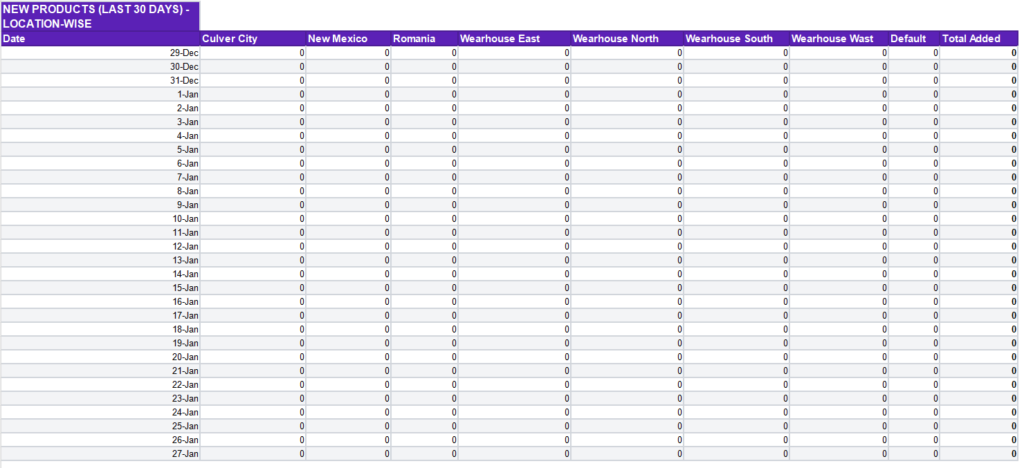
✅ Your attached file is an example of this exact visual format.
Report Structure (Sections Included)
The generated report typically contains:
Report Header
Shows:
- Report title (Location Wise Product & Inventory Dashboard Report)
- Generated date/time
- Store name
- Currency
Summary Statistics
Includes:
- Total Products
- Total Locations
- Total Orders
- Total Revenue
- Total Investment
- Total Stock
Location-Wise Breakdowns
Tables such as:
- Products by Location
- Stock Levels by Location
- Orders by Location
- Revenue by Location
Profitability & Aging by Location
A detailed table including:
- Inventory Value
- Margin Value
- Margin %
- Dead Stock Value & Units (unsold for last 90 days)
- Avg Age (days)
- Shrinkage %
New Products (Last 30 Days) – Location Wise
A date-based table showing how many products were added per location.
Footer
A closing message and report signature.
Visual Styling (Your Format)
Your report format includes:
- Purple header theme (
#5b21b6) - Bold section headers
- Alternating row color for readability
- Emphasis styles like:
.percentage(highlighted percent values).stock-low/.stock-out(low/out-of-stock markers)- Badge styles for status labels
This makes the export presentation-ready for managers and clients.
How to Open the File
Microsoft Excel (Recommended)
- Double-click the exported
.xls - Excel will open it with formatting intact
Google Sheets
- Upload the
.xlsfile - Formatting usually works, but some CSS visuals may look slightly different than Excel
Notes & Best Practices
- Use CSV export when you need raw data for analysis.
- Use Excel (HTML) export when you need a clean visual report for sharing/printing.
- The report content respects the dashboard filters (date range, location, status), so always set filters before exporting.